
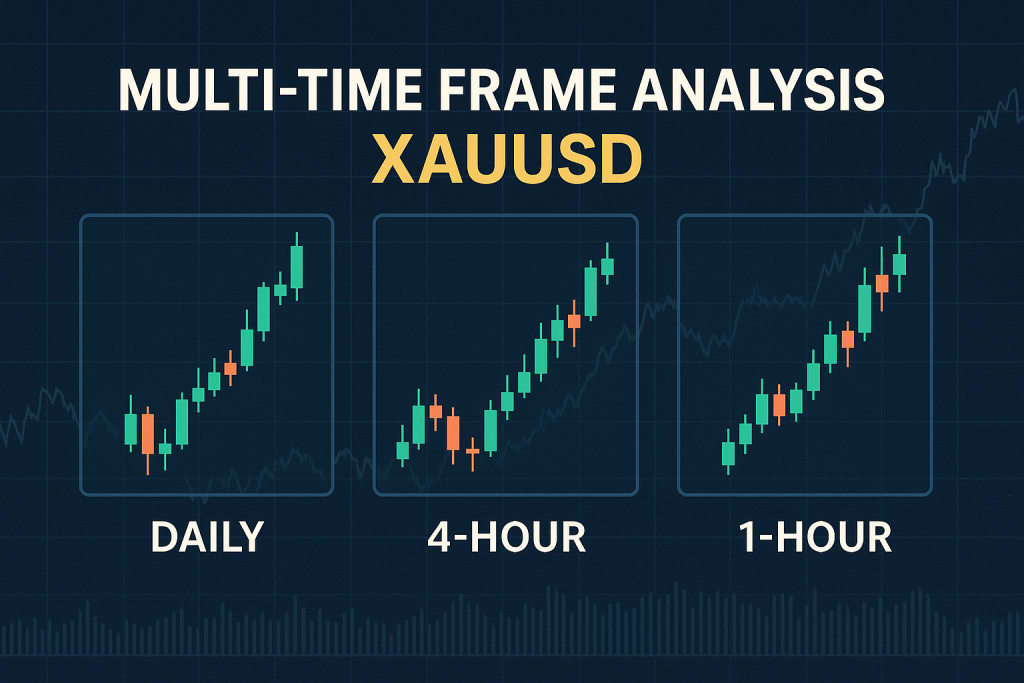
Multi-Time Frame Analysis (MTFA) for XAUUSD
Candlestick patterns can serve as signals for potential market entries and exits. For instance, patterns like Doji, Hammer, or Engulfing can suggest reversals or continuations

Introduction
Multi-Time Frame Analysis (MTFA) is a powerful trading technique that involves analyzing a financial instrument across multiple chart time frames before making a trading decision. It helps traders see the bigger picture, understand market structure, and refine entries and exits. In Forex and commodities trading—especially for a volatile asset like XAUUSD (Gold)—MTFA can significantly improve your edge.
XAUUSD is one of the most traded commodities in the world. It’s highly sensitive to macroeconomic factors such as inflation, interest rates, and geopolitical tensions. Because of this, its price action often exhibits strong trends on higher time frames and sharp fluctuations on lower ones. Using MTFA allows traders to align their trades with the dominant trend while optimizing entries using lower time frames.
Why Use Multi-Time Frame Analysis on XAUUSD?
Volatility management: XAUUSD is prone to large intraday moves. MTFA helps identify which moves are part of a larger trend and which are just noise.
Trend confirmation: Avoid trading against strong trends by using higher time frames as a directional filter.
Precision entries: Lower time frames offer better entry points with reduced stop-loss distances.
Higher probability setups: Confluence across multiple time frames generally produces more reliable trades.
Typical Time Frame Combinations for XAUUSD
MTFA typically involves using three layers of time frames:
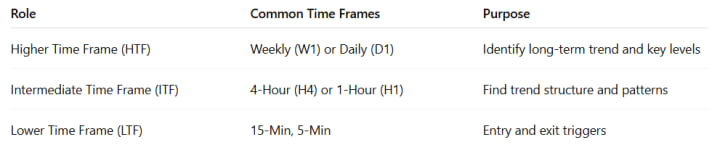
Example combo for swing traders:
HTF: Daily (D1)
ITF: 4H
LTF: 15-min
Example combo for intraday traders:
HTF: 4H
ITF: 1H
LTF: 5-min
Step-by-Step MTFA for XAUUSD
1. Start with the Higher Time Frame (e.g., Daily or Weekly)
On the HTF, you should:
Identify trend direction: Is gold trending up, down, or consolidating?
Mark key levels: Support, resistance, trendlines, and supply/demand zones.
Analyze market structure: Look for higher highs/lows (bullish) or lower highs/lows (bearish).
Example (Daily Chart):
Let’s assume XAUUSD is in an uptrend, forming higher lows and higher highs. You see price currently approaching a previous resistance zone near $2,400. You mark it as a potential reaction area.
HTF Conclusion: Bullish trend, approaching resistance — look for buy setups above support or wait for breakout confirmation.
2. Zoom into the Intermediate Time Frame (e.g., 4H)
On the ITF:
Look for confirmation of trend continuation or signs of reversal.
Identify price patterns: flags, triangles, double tops/bottoms.
Refine your key levels for precision.
Watch for momentum indicators: RSI, MACD, volume, etc.
Example (4H Chart):
Price pulls back to a previous 4H demand zone near $2,360, forming a bullish engulfing candle. RSI is showing bullish divergence. This confirms that bulls may step in soon.
ITF Conclusion: Pullback within a bullish trend; signs of a bounce. Prepare to look for entries on the lower time frame.
3. Drop to the Lower Time Frame (e.g., 15-min or 5-min)
This is your execution time frame:
Wait for entry signals: break of structure, candlestick patterns, moving average crossovers, etc.
Place stop-losses and take-profits based on recent structure.
Ensure risk-reward ratio is favorable (typically 1:2 or higher).
Example (15-Min Chart):
Price breaks a minor lower high and closes above. You enter long on the retest, placing a stop-loss just below the recent swing low and targeting the previous daily resistance.
LTF Conclusion: Clean bullish entry confirmed with good RR. Trade aligns with ITF and HTF trends.
Benefits of MTFA on XAUUSD
✅ 1. Avoids Trading Against the Trend
Traders often lose by entering positions based on lower time frames that contradict higher time frame trends. MTFA prevents this by using higher charts as a trend filter.
✅ 2. Combines Strategic Vision with Tactical Precision
HTF gives the strategic view (where the market is likely headed), while the LTF gives the tactical entry point (when to enter/exit with precision).
✅ 3. Enhances Risk Management
MTFA enables tighter stop-loss placements when entries are made on LTFs, reducing overall trade risk while maintaining alignment with larger trends.
Common Mistakes in MTFA
❌ Overanalyzing Time Frames
Using too many time frames can lead to conflicting signals and decision paralysis. Stick to a 3-time-frame model.
❌ Forcing Confluence
Not every time frame will perfectly align all the time. Avoid trying to find trades where none exist just to justify an entry.
❌ Ignoring the Big Picture
Trading solely on lower time frames without higher time frame context can lead to poor decisions and unnecessary stop-outs.
Toolsand Indicators for MTFA on XAUUSD
Price Action: Candlestick patterns, support/resistance, break of structure.
Moving Averages: 20/50/200 EMAs for trend filtering.
Fibonacci Retracement: For measuring pullbacks during trends.
RSI/MACD: Identify divergence or overbought/oversold conditions.
Volume Profile: To spot institutional interest and key price zones.
Practical Trading Example (Swing Trade on XAUUSD)
Scenario:
D1 shows an uptrend; price is above 50 EMA and forming higher lows.
H4 shows a pullback into a Fibonacci 61.8% zone with bullish engulfing candles.
15M shows a clean double bottom, followed by a break of structure and a retest.
Trade Setup:
Enter long on the 15M break/retest.
Stop-loss: Below recent LTF swing low.
Take-profit: Near D1 resistance ($2,400).
R:R: 1:3
This trade is high-probability because it aligns across all time frames.
When to Adjust Your Time Frame Setup
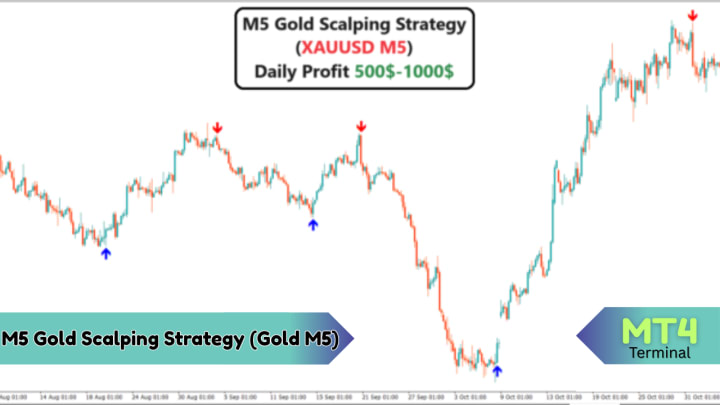
Download Link:- https://forexwebstore.com/product/xauusd-arrow-indicator-gold-m1/
In high-volatility events (e.g., FOMC, NFP), avoid using very low time frames as whipsaws are common.
For news-based trading, higher time frames help you avoid emotional decisions.
As your experience grows, you can shorten or lengthen your time frames depending on your trading style.
About the Creator
Alex John
Today I will share with you how to trade option trading. Although this indicator is made for Stock Market, Forex Market if you work in other pairs then you can use it. Like:- Nifty, Banknifty, XAUUSD, EURUSD, USDCAD, EURCHF, GBPUSD,etc.
Probiotics Market Size, Trends & Forecast 2025–2033 | Renub Research
Introduction: The Rise of the “Good Bacteria” Economy The global probiotics market is undergoing a remarkable transformation, driven by changing consumer lifestyles, growing health awareness, and a strong shift toward preventive healthcare. According to Renub Research, the Probiotics Market is expected to grow from US$ 88.55 billion in 2024 to US$ 270.28 billion by 2033, registering an impressive CAGR of 13.20% during 2025–2033.
By Sakshi Sharma3 days ago in Trader
BYD Stock Price Analysis: Should You Buy Before the Next Surge?
The BYD stock price has caught the eye of investors worldwide. As one of the leading electric vehicle companies, BYD continues to show strong growth in sales and production. Many investors are asking: is now the right moment to invest? This article explores the factors affecting the BYD stock price, current trends, potential risks, and tips for making a smart investment decision.
By hamza mirza5 days ago in Trader


Comments
There are no comments for this story
Be the first to respond and start the conversation.